
Your numbers, clear to everyone.
Only the people who have to will read a table of figures. An infographic is understood even by someone who just glances at it. We pick the number that matters most and put it up front, with the rest backing it up.
What you get
The deliverables, in short. What exactly is included goes in the quote.
- 01
The story in the data
We go through the figures together and choose the few that mean something to your client, not everything in the spreadsheet.
- 02
The right chart
Bars, a line, a map, a flow or one big number: we pick the form by what you want understood.
- 03
In your identity
Your brand’s colours, fonts and icons, so the infographic sits well next to everything else.
- 04
Versions by format
The same information for an A4 page, a 16:9 slide, a LinkedIn post and your website.
- 05
Clear without colour
We check contrast and labels, so the chart reads in black-and-white print and for people who can’t tell colours apart.
- A4 or A3 PDF
- 16:9 slide
- 1080×1350 post
- LinkedIn carousel PDF
- SVG for the web
- PNG
How we work
Four steps, from the first message to the final files.
- 1
The talk
You tell us what you do, who you sell to and what you don’t want to look like. We also look at competitors.
- 2
The directions
We show you the logo directions on real applications: storefront, business card, profile.
- 3
Refinement
You pick a direction, we take it all the way. Rounds of changes are written in the quote.
- 4
The final pack
Vector logo in every version, colours, fonts and usage rules.
Work we made
Only real projects, already on our site.
Questions
What clients ask us.
What should I send you?
The data, even in a messy spreadsheet, and what you want the reader to understand. We note the source in small print under the chart, so it can be checked.
Do you round the figures to make them look better?
No. We use them exactly as you give them and ask when something doesn’t add up. We take care of how the numbers look, you take care of what they say.
Where can I use them?
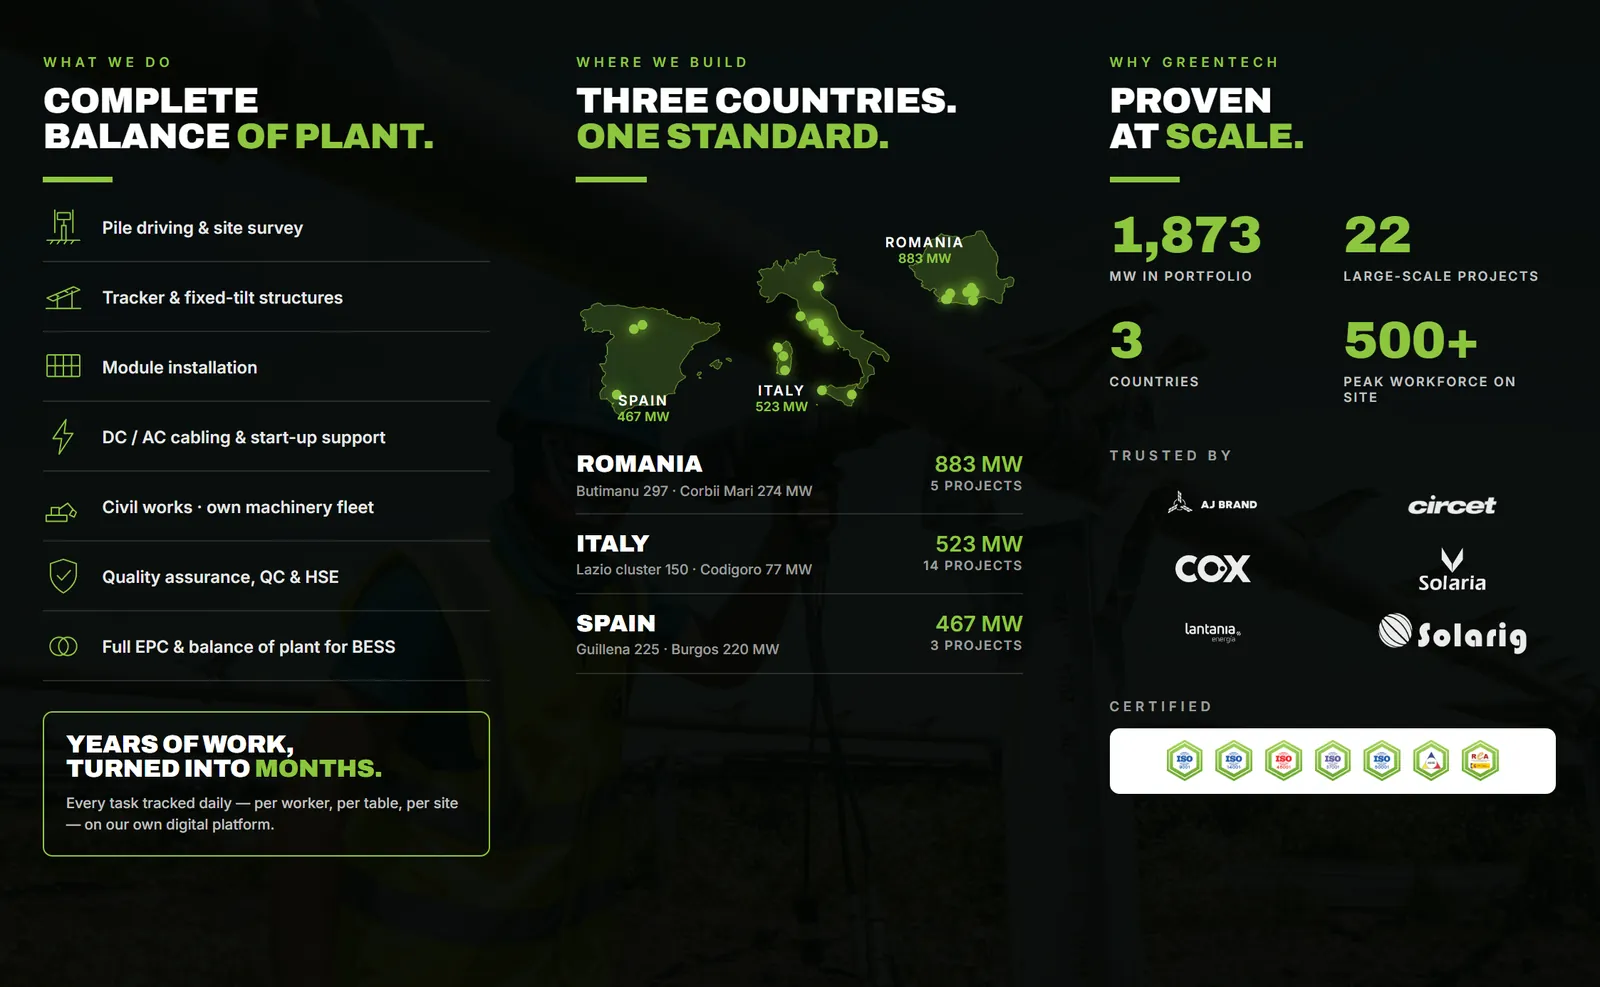
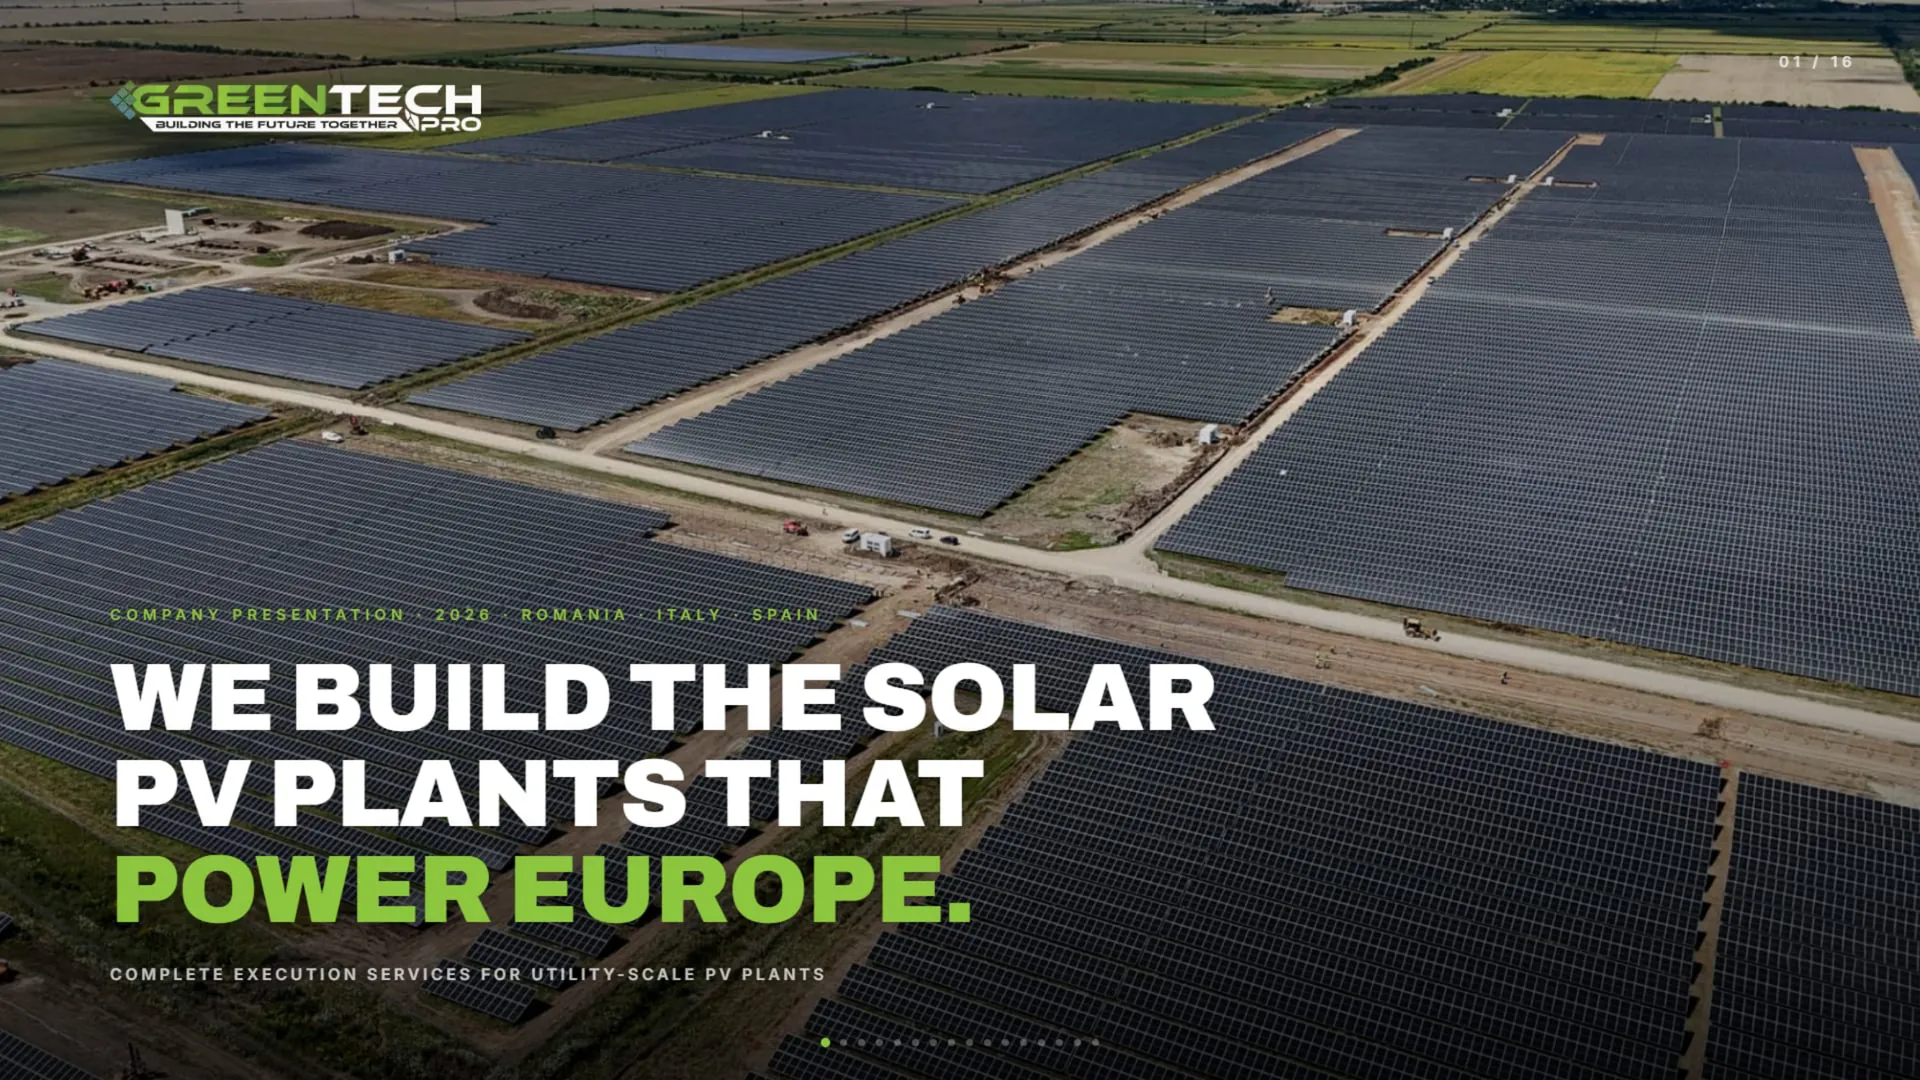
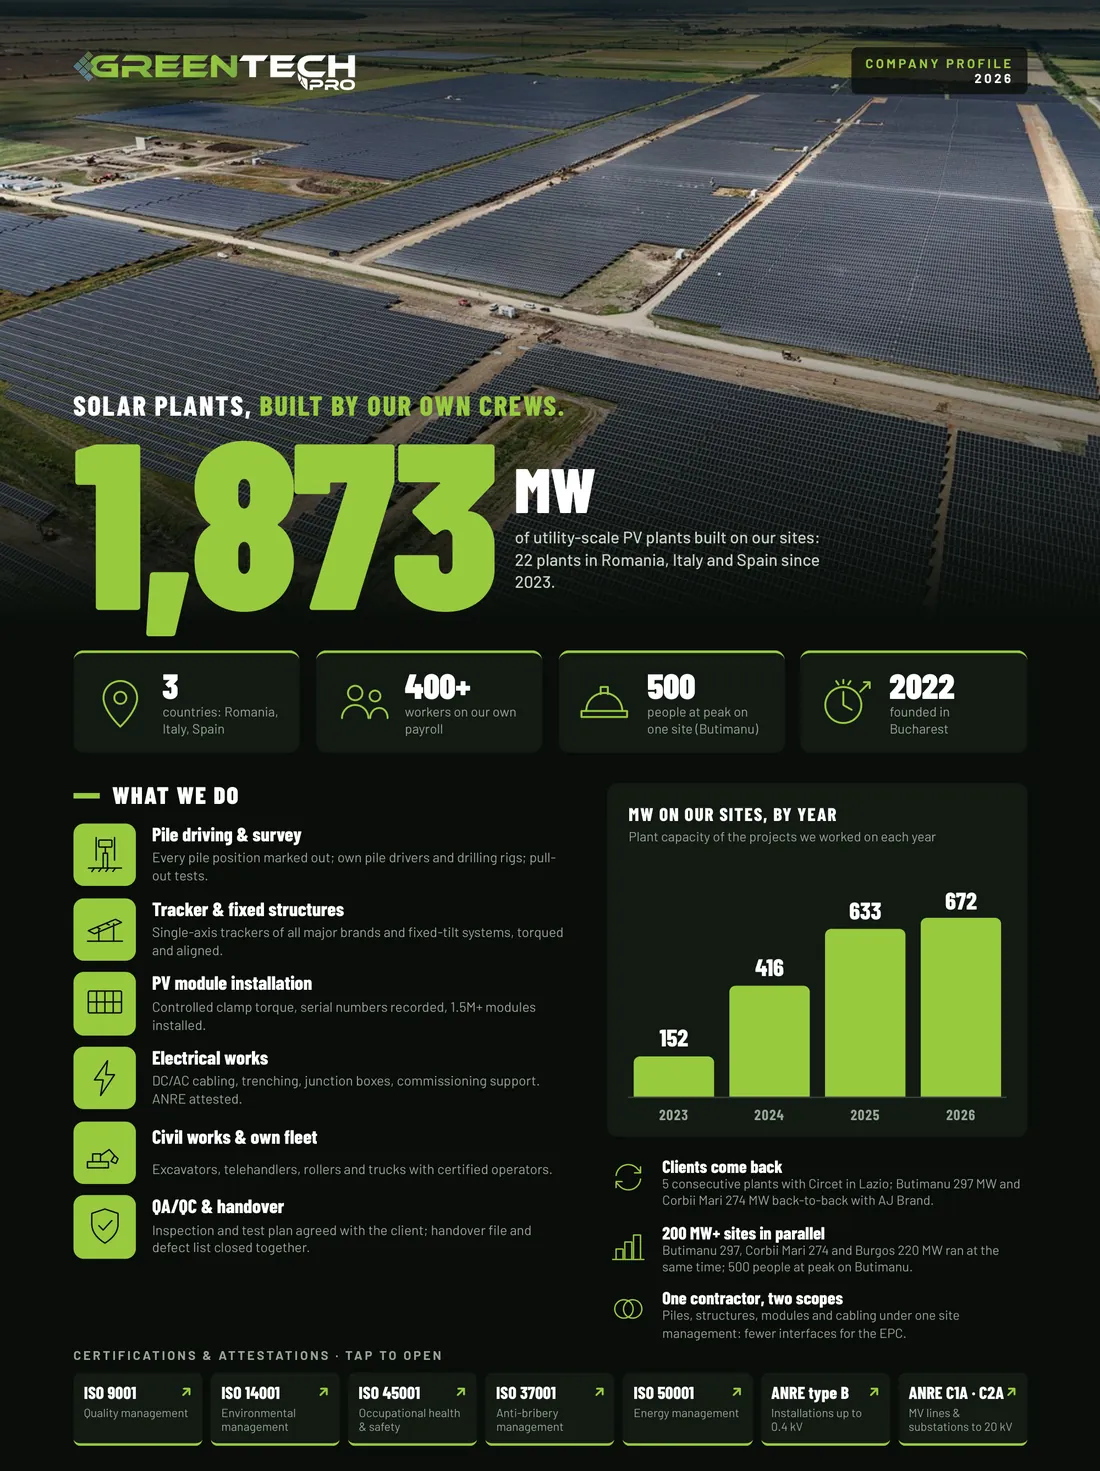
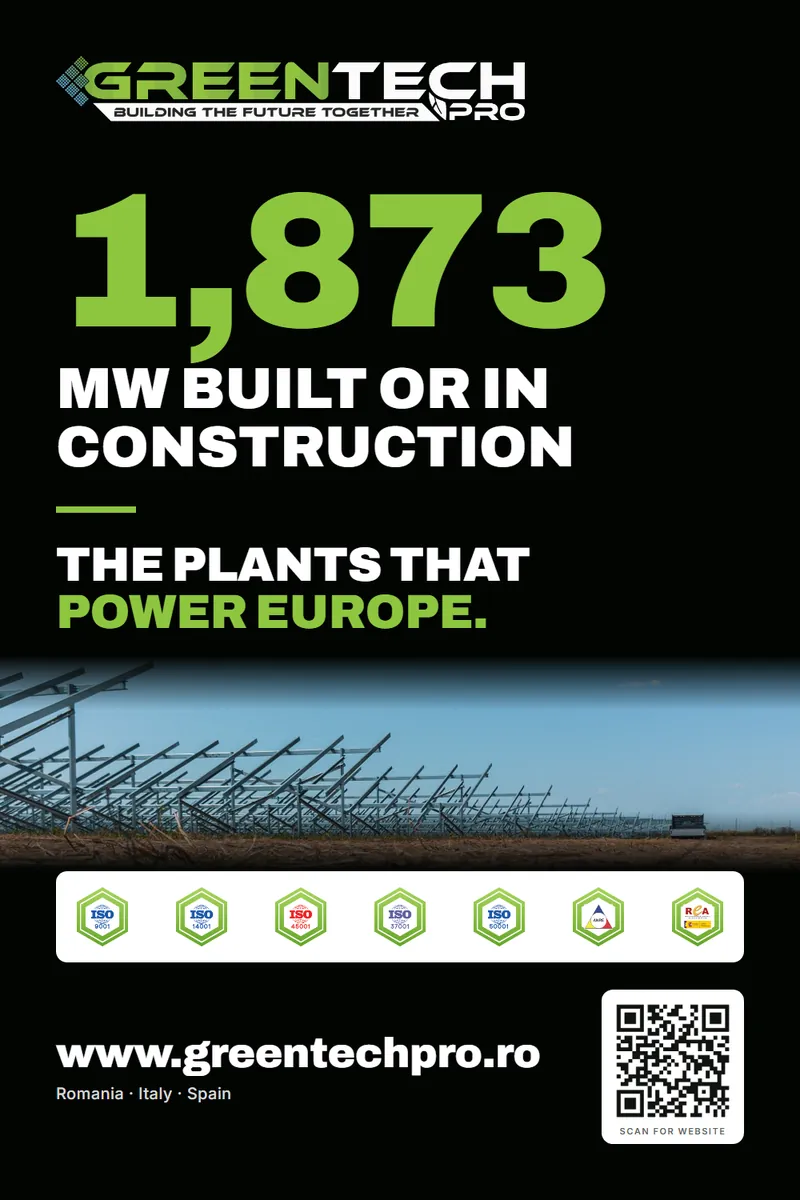
In your company presentation, company profile, proposals, reports, on LinkedIn and on your website. The Greentech company profile, for instance, fits the firm’s figures onto two A4 pages: megawatts built, parks, countries and people.
Who owns the logo in the end?
You do. After full payment, the economic rights to the final deliverables pass to you through a written assignment, as set out in our Terms.
I already have a logo. Can you reuse it?
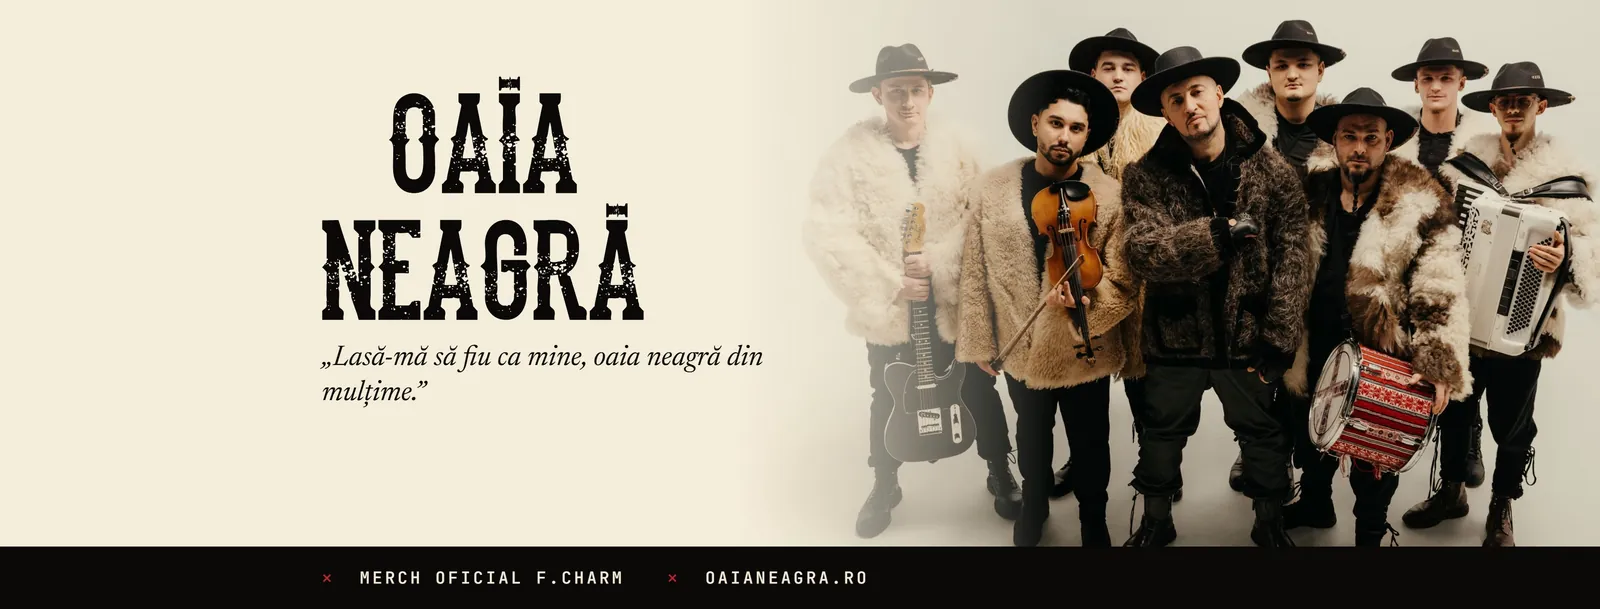
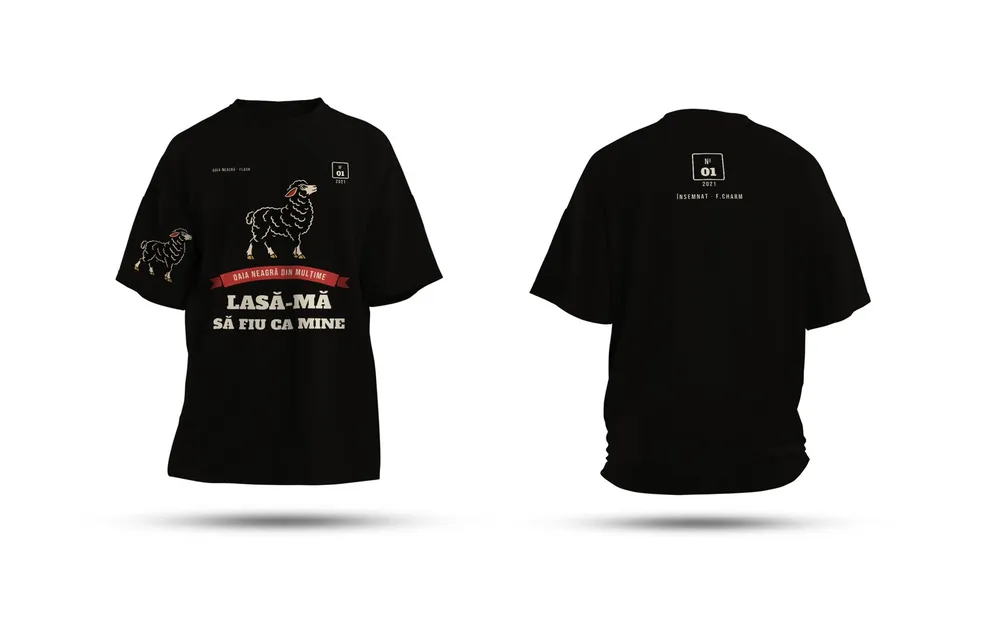
Yes. Often you don’t need a new one: we redraw it cleanly as a vector and build the rest of the identity around it, as we did for Oaia Neagră and Major Music.
How much does it cost?
It depends on what it covers: how many pieces, how many versions, whether printing or production is included. Tell us what you need and we come back with a clear quote, after a short talk.
From the blog
Short guides on the topic, written in the studio.
Related
Goes well with
Brand identities
Let’s start.
Tell us in two lines what you need. We come back with a plan and a clear quote.